Table Of Contents
   About
   Requirments
   Line Plot
   Scatter Plot
   Bar Graph
   Stacked Bar Graph

   AboutTOP
   

   RequirementsTOP
 Needs to be linked to EasyLife library and GD library.

   Line PlotTOP
GUGRAPH* g = NULL;
FILE* fp = NULL;

/* create graph */
g = guCreateGraph();

/* open target file */
fp = fopen("target1.png","wb");

/* desc */
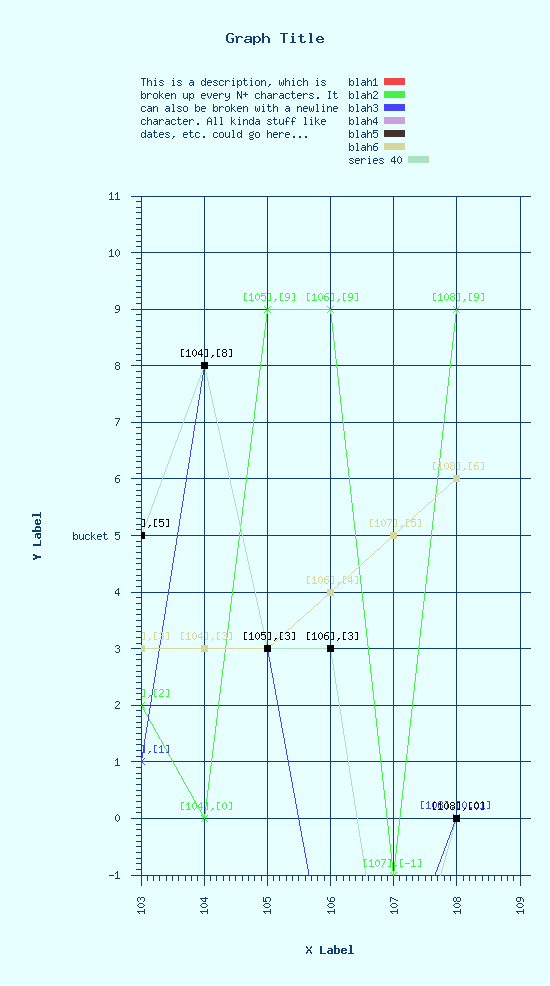
guSetDescription( g, "This is a description, which is broken up every N+ characters. It can also be broken with a newline character. All kinda stuff like dates, etc. could go here...");
guSetBackColor( g, 232, 255, 255 );

/* add a series */
guSetSeriesName( g, 25, "blah1");
guSetSeriesName( g, 27, "blah2");
guSetSeriesName( g, 28, "blah3");
guSetSeriesName( g, 29, "blah4");
guSetSeriesName( g, 30, "blah5");
guSetSeriesName( g, 31, "blah6");
//guSetSeriesName( g, 'S', "using ascii value of S as series id");

/* add more data */
guAddSeriesDataPoint( g, 27, 103, 2 );
guAddSeriesDataPoint( g, 27, 104, 0 );
guAddSeriesDataPoint( g, 27, 105, 9 );
guAddSeriesDataPoint( g, 27, 106, 9 );
guAddSeriesDataPoint( g, 27, 107, -1 );
guAddSeriesDataPoint( g, 27, 108, 9 );

/* add more data */
guAddSeriesDataPoint( g, 28, 103, 1 );
guAddSeriesDataPoint( g, 28, 104, 8 );
guAddSeriesDataPoint( g, 28, 105, 3 );
guAddSeriesDataPoint( g, 28, 106, -3 );
guAddSeriesDataPoint( g, 28, 107, -3 );
guAddSeriesDataPoint( g, 28, 108, .01 );

/* add more data */
guAddSeriesDataPoint( g, 40, 103, 5 );
guAddSeriesDataPoint( g, 40, 104, 8 );
guAddSeriesDataPoint( g, 40, 105, 3 );
guAddSeriesDataPoint( g, 40, 106, 3 );
guAddSeriesDataPoint( g, 40, 107, -4 );
guAddSeriesDataPoint( g, 40, 108, 0 );

/* add more data */
guAddSeriesDataPoint( g, 31, 103, 3 );
guAddSeriesDataPoint( g, 31, 104, 3 );
guAddSeriesDataPoint( g, 31, 105, 3 );
guAddSeriesDataPoint( g, 31, 106, 4 );
guAddSeriesDataPoint( g, 31, 107, 5 );
guAddSeriesDataPoint( g, 31, 108, 6 );

/* change bucket size */
guSetXBucketSize( g, .1 );

/* change bucket back */
guXBucketSizeAuto( g );

/* change image width */
guImageHeightDynamic( g );
guImageWidthDynamic( g );

/* grid */
guShowYGrid( g );
guShowXGrid( g );

/* descriptions */
guSetDescriptionCharsPerLine( g, 30 );
guAddYBucketDescription( g, 5, "bucket 5" );

/* set graph type */
guSetStyle( g, GU_STYLE_LINE_PLOT );
guSetYRange( g, -1,11 );

/* marker */
guSetMarker( g, 25, '+' );
guSetMarker( g, 27, 'X' );
guSetMarker( g, 28, '*' );
guSetMarker( g, 31, '.' );
guSetMarker( g, 40, '.' );

/* coordinates */
guShowPointCoordinates( g, 25 );
guShowPointCoordinates( g, 27 );
guShowPointCoordinates( g, 28 );
guShowPointCoordinates( g, 31 );
guShowPointCoordinates( g, 40 );

/* change marker colors */
guSetMarkerColor( g, 40, 0, 0, 0 );
guSetMarkerSize( g, 40, 6 );
guSetMarkerColor( g, 25, 0, 0, 0 );

/* Set log if desired */
//guXAxisLog( g );
//guXAxisLog( g );

/* change a few colors */
//guSetSeriesColor( g, 25, 255, 50, 50 );
//guSetSeriesColor( g, 27, 50, 255, 50 );
//guSetSeriesColor( g, 28, 50, 50, 255 );

/* open target file */
guWriteGraphPng(g,fp);

/* destroy graph and close file */
guDestroyGraph(g);
fclose(fp);


   Scatter PlotTOP
GUGRAPH* g = NULL;
FILE* fp = NULL;

/* create graph */
g = guCreateGraph();
guSetStyle( g, GU_STYLE_SCATTER_PLOT );

/* open target file */
fp = fopen("target2.png","wb");

/* set some graph properties */
guSetYLabel(g,c1= _FILTER_getColNameFromValue(ColumnsPtr,selectedOrder) );
guSetXLabel(g,c2= _FILTER_getColNameFromValue(ColumnsPtr,selectedOrder2) );
sprintf(statement,"%s vs. %s", c1, c2);
guSetTitle( g, statement );
if (cgiGetItem("graphdesc")) guSetDescription( g, desc_string );
guHideLegend( g );
guSetYRange( g, rangelow, rangehigh );
guSetYBucketSize( g, bucketSize);
guSetXRange( g, rangelow2, rangehigh2 );
guSetXBucketSize( g, bucketSize2);
if (isImageWidthDynamic) guImageWidthDynamic( g );
if (isImageHeightDynamic) guImageHeightDynamic( g );

if (cgiGetItem("ygrid")) guShowYGrid(g); else guHideYGrid(g);
if (cgiGetItem("xgrid")) guShowXGrid(g); else guHideXGrid(g);
if (cgiGetItem("ylog")) guYAxisLog(g); else guYAxisLinear(g);
if (cgiGetItem("xlog")) guXAxisLog(g); else guXAxisLinear(g);


/* open target file */
guWriteGraphPng(g,fp);

/* destroy graph and close file */
guDestroyGraph(g);
fclose(fp);


   Bar PlotTOP
GUGRAPH* ScoreGraph = NULL;
FILE* fp = NULL;

/* create graph */
ScoreGraph = guCreateGraph();

/* open target file */
fp = fopen("target3.png","wb");

/* properties */
guImageWidthDynamic(ScoreGraph);
guImageHeightDynamic(ScoreGraph);
guSetTitle(ScoreGraph,"Score Distribution");
guSetXLabel(ScoreGraph,"score");
guSetYLabel(ScoreGraph,"frequency");
guSetXBucketSize(ScoreGraph,1.0);
guHideLegend(ScoreGraph);

/* data */
rSum=sum=0.0;
for (i=0; i<=4000; i++) {
if (scores[i]) {
guAddSeriesDataPoint(ScoreGraph,1,i,scores[i]);
sum+=scores[i];
}
}
l5=r5=l=m=r=0;
for (i=0; i<=4000; i++) {
rSum+=scores[i];
if (!l5 && rSum>=(sum/20.0)) {
guAddVLine(ScoreGraph, i+1, "5%% on the left");
l5=1;
} else if (!r5 && rSum>=(sum/20.0*19.0)) {
guAddVLine(ScoreGraph, i+1, "95%% on the left");
r5=1;
} else if (!l && rSum>=(sum/4.0)) {
guAddVLine(ScoreGraph, i+1, "25%% on the left");
l=1;
} else if (!m && rSum>=(sum/2.0)) {
guAddVLine(ScoreGraph, i+1, "50%% on the left");
m=1;
} else if (!r && rSum>=(sum/4.0*3.0)) {
guAddVLine(ScoreGraph, i+1, "75%% on the left");
r=1;
}
}

/* open target file */
guWriteGraphPng(ScoreGraph,fp);

/* destroy graph and close file */
guDestroyGraph(ScoreGraph);
fclose(fp);


   Stacked Bar PlotTOP
GUGRAPH* g = NULL;
FILE* fp = NULL;

/* create graph */
g = guCreateGraph();

/* open target file */
fp = fopen("target4.png","wb");

/* properties */
guSetTitle( g, "Alignment breakdowns" );
guSetDescription( g, "Shows the breakdown of 'average' alignments under parameters as listed on X axis." );
guSetXLabel( g, "Parameters" );
guSetYLabel( g, "Percent Makeup" );
guSetSeriesName( g, 1, "Single Matches");
guSetSeriesName( g, 2, "Extended Matches");
guSetSeriesName( g, 3, "Indels");
guSetSeriesName( g, 4, "Mismatches");
guSetStackedBarGraphSortFunction( g, GU_SORT_SERIES_ID );
guImageHeightDynamic(g);
guSetDimensions( g, 700, 1000 );
guShowYGrid( g );
guSetYRange( g, 0, 70 );

//guShowPointCoordinates( g, 1 );
//guShowPointCoordinates( g, 2 );
//guShowPointCoordinates( g, 3 );
//guShowPointCoordinates( g, 4 );

int i = 1;
while (!dataqueue.empty())
{
stackGraphData curr = dataqueue.front();
guAddSeriesDataPoint( g, 1, i, curr.single );
guAddSeriesDataPoint( g, 2, i, curr.ext );
guAddSeriesDataPoint( g, 3, i, curr.indel );
guAddSeriesDataPoint( g, 4, i, curr.mismatch );
guAddXBucketDescription( g, i, curr.label );
dataqueue.pop();
i++;
}
guSetStyle( g, GU_STYLE_STACKED_BAR_GRAPH);
guXBucketMidpointMarkingOn(g);

/* open target file */
guWriteGraphPng(g,fp);

/* destroy graph and close file */
guDestroyGraph(g);
fclose(fp);